The 1:7 Fiscal Math Behind NEMA & FEMA’s 2026 Disaster Campaign
The National Emergency Management Agency (NEMA) and the Federal Capital Territory Emergency Management Agency (FCT FEMA) have officially launched the 2026 Disaster Preparedness Campaign. While the launch features the usual sensitization walks and public enlightenment drives, a macro-fiscal review of disaster management data reveals a deeper, economically driven motive: the mathematical imperative of shifting from expensive reactive relief to cheap proactive mitigation.
Globally, disaster management follows a strict economic ratio. For every $1 invested in disaster risk reduction, a country saves approximately $7 in post-disaster recovery costs. By launching the 2026 campaign early, NEMA and FCT FEMA are attempting to alter the fiscal trajectory of emergency spending in the capital territory.
The Economics of Early Warning: The 1:7 ROI
Nigeria’s historical disaster management data exposes a heavily skewed funding matrix. The vast majority of emergency funds are deployed *after* a disaster has struck—spent on relief materials, resettlement, and infrastructure reconstruction. The 2026 campaign seeks to correct this mathematical imbalance by front-loading the investment into preparedness.
When analyzed against the backdrop of recurring floods in FCT satellite towns like Gwagwalada, Nyanya, and Karu, the data shows that clearing drainages and relocating flood-prone communities pre-rainy season is exponentially cheaper than rebuilding washed-away homes and providing IDP camp logistics post-flood.
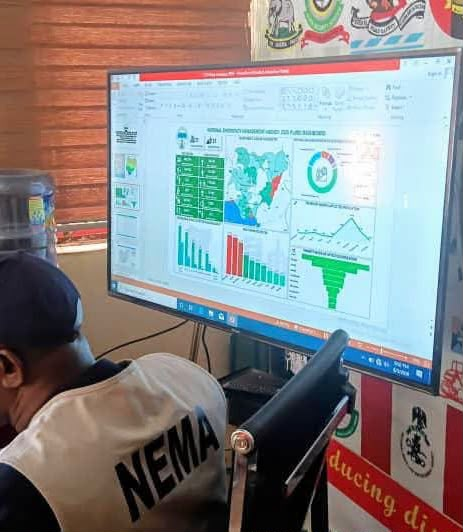
Hover over the bars to compare historical spending on post-disaster relief versus pre-disaster preparedness.
The FCT Vulnerability Index: Why the Capital?
The decision to aggressively push the 2026 campaign in the FCT is anchored in localized climate and demographic data. Abuja is not just the administrative capital; it is one of the fastest-growing urban centers in Africa, with a massive annual population influx that has led to uncontrolled building on natural waterways.
Data from previous years indicates that FCT records the highest frequency of localized urban flooding in the North-Central zone, alongside devastating windstorms and fire outbreaks in informal settlements. The vulnerability index peaks between June and August, making early Q2 preparedness campaigns a statistical necessity rather than a mere administrative routine.
Hover over the doughnut to view the percentage breakdown of disaster types in the FCT.
DATA SNAPSHOT: THE PREPAREDNESS EQUATION
- Global ROI on Preparedness: $1 Invested = $7 Saved in Recovery
- Peak Vulnerability Window: June – August (Rainy Season Peak)
- FCT Highest Risk Zones: Riverine settlements & informal urban slums
- NiMet 2026 Rainfall Prediction: Earlier onset, prolonged duration, higher intensity
- Primary Economic Driver: Protecting FCT’s multi-billion naira infrastructure base
The Climate Trajectory: NiMet’s Rainfall Data
The timing of the NEMA/FEMA campaign is directly correlated with meteorological data. The Nigerian Meteorological Agency (NiMet) has consistently tracked a shift in rainfall patterns, with the rainy season becoming shorter in duration but vastly higher in volume and intensity.
This means the volume of water dropping on the FCT in a 90-day window is now significantly higher than it was a decade ago. Without corresponding investments in drainage infrastructure and public awareness, the mathematical result is predictable: overwhelmed urban runoff systems and catastrophic flooding.
Hover over the data points to view the correlation between rainfall volume and disaster incidents.
The Outlook: Sensitization vs. Structural Investment
While the 2026 campaign is a step in the right direction, the data dictates that sensitization alone cannot solve a structural mathematical deficit. Public awareness can reduce human casualties, but it cannot stop a flood when drainages are blocked by refuse or when houses are built on flood plains.
For NEMA and FCT FEMA to truly achieve the 1:7 ROI, the preparedness campaign must be backed by structural enforcement data—demolishing structures on waterways, enforcing building codes, and digitally mapping flood-risk zones. If the campaign remains strictly rhetorical, the 2026 fiscal ledger will once again record massive losses in post-disaster recovery spending.